
Last updated: 26 October 2026
Verified by: Kishore Gupta - Technical Expert
What is a stress-strain curve?
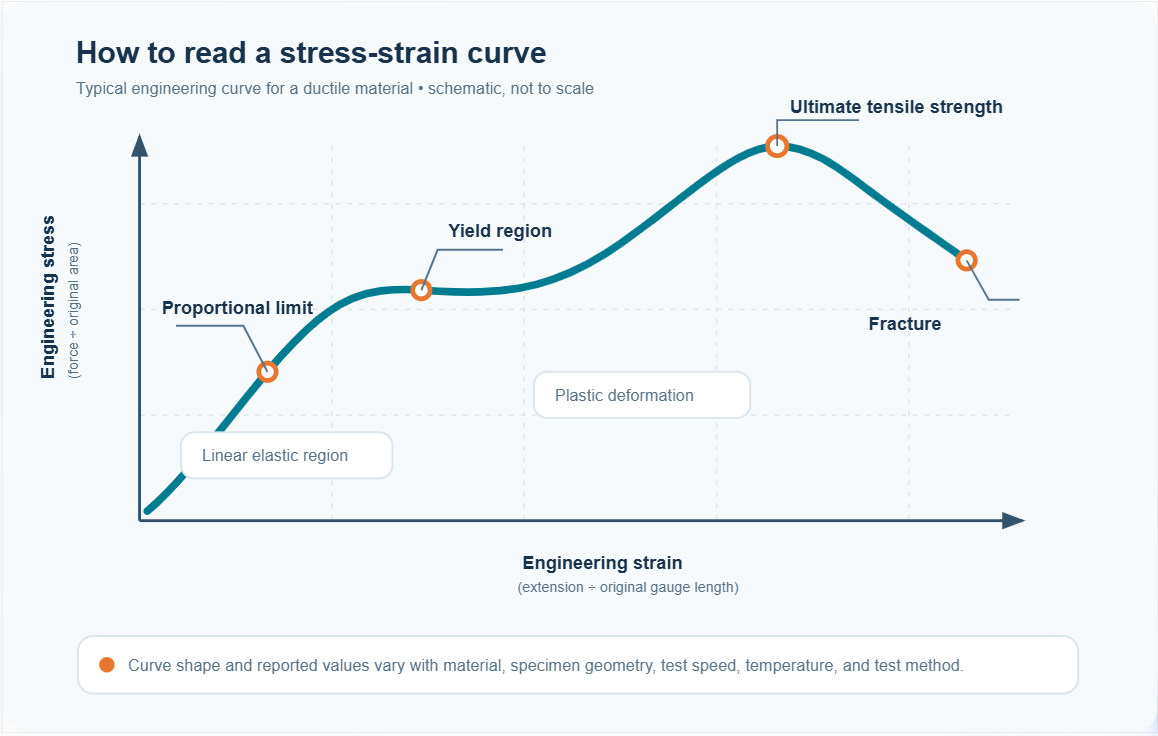
A stress-strain curve is a graph of a material’s response as it is loaded. In a tensile test, the vertical axis shows tensile stress and the horizontal axis shows tensile strain. The curve helps engineers assess stiffness, yielding, tensile strength, elongation, and fracture behavior under the test conditions.
The shape of the curve matters as much as its highest point. A steep initial slope indicates a stiff material; the amount of strain before fracture gives an indication of how much it can stretch; and the transition into permanent deformation shows when the specimen no longer returns to its original dimensions after unloading.
How are stress and strain calculated?
A tensile testing machine applies a pulling force to a specimen and records the force and extension as the test proceeds. The software can then convert those measurements into stress and strain.
Engineering stress
Engineering stress is calculated using the specimen’s original cross-sectional area:
Engineering stress, σ = F / A₀
Where:
- σ is engineering stress, commonly reported in megapascals (MPa) or newtons per square millimetre (N/mm²)
- F is the applied tensile force
- A₀ is the specimen’s original cross-sectional area
Because 1 N/mm² equals 1 MPa, results calculated in N/mm² can be reported directly in MPa.
Engineering strain
Engineering strain is the extension divided by the original gauge length:
Engineering strain, ε = ΔL / L₀
Where:
- ε is strain, a dimensionless ratio
- ΔL is the change in gauge length
- L₀ is the original gauge length
Strain may be shown as a decimal or as a percentage. A strain of 0.05 is the same as 5%.
A quick example
Suppose a specimen has an original cross-sectional area of 20 mm² and reaches a force of 1,000 N. Its engineering stress at that point is:
1,000 N ÷ 20 mm² = 50 N/mm² = 50 MPa
If its original gauge length is 50 mm and it has extended by 2.5 mm, its engineering strain is:
2.5 mm ÷ 50 mm = 0.05 = 5%
The values only make sense when the specimen dimensions, test method, and measurement method are recorded correctly.
What do the axes and curve show?
For a standard tensile stress-strain graph:
- The horizontal axis is strain, which describes the specimen’s relative elongation.
- The vertical axis is stress, which describes the applied force divided by the chosen cross-sectional area.
The graph is not a direct plot of force against extension. It normalizes the measurements by specimen dimensions, making it more useful for comparing materials and specimens of different sizes. The result still depends on the test method and conditions, so comparisons should be made between tests performed on a consistent basis.
What are the main regions and points on the curve?
A typical ductile metal curve is often introduced as a sequence of elastic deformation, yielding, plastic deformation, maximum engineering stress, and fracture. Real curves vary: plastics may show pronounced yielding, gradual yielding, necking, or no clear yield point, while brittle materials may fracture with little visible plastic deformation.
Linear elastic region and elastic modulus
At the start of many tensile curves, stress increases approximately in proportion to strain. In this linear region, the slope is the elastic modulus (often Young’s modulus in tension):
Elastic modulus, E ≈ change in stress / change in strain
A larger modulus means the material is stiffer: it undergoes less elastic strain for a given stress. Modulus is not the same as strength. A material can be stiff but fail at a relatively low stress, or be flexible while still stretching substantially before rupture.
The proportional limit marks where the curve stops following a straight-line stress-strain relationship. The elastic limit refers to the boundary beyond which permanent deformation remains after unloading. These terms are related but are not automatically identical.
Yield strength or proof stress
Yielding marks the onset of significant permanent deformation. Some materials show a distinct yield point; others do not. For materials without a clear yield point, a specified offset method may be used to report a proof stress, such as a 0.2% offset value where the applicable test method requires it.
The reported value should state how yield was defined. A “yield strength” without its method or criterion can be difficult to compare across reports.
Plastic deformation and strain hardening
Beyond yielding, the specimen continues to deform permanently. In some materials, additional stress is needed to continue deforming it; this is commonly described as strain hardening. The curve’s shape in this region reveals how the material carries load as deformation grows.
After the test, an unloaded specimen that has passed the elastic limit retains some permanent elongation. That residual change is why the elastic and plastic parts of a curve are useful for distinguishing reversible deformation from permanent set.
Ultimate tensile strength
Ultimate tensile strength (UTS) is the maximum engineering stress reached during a tensile test. It is the peak of the engineering stress-strain curve, calculated using the original area.
UTS is not necessarily the stress at fracture. In a ductile specimen, localized necking may begin around the peak load. The engineering stress can then fall because it continues to use the original area, even as the specimen’s local cross-section becomes smaller.
Necking and fracture
Necking is localized thinning of the specimen. It is common in ductile materials after the maximum load, though the details depend on material and test geometry. Fracture is the point at which the specimen separates.
Elongation at break is typically calculated from the change in gauge length at fracture, according to the relevant method. It should not be read as a universal property independent of specimen shape, gauge length, conditioning, and test procedure.
How do different materials appear on a stress-strain graph?
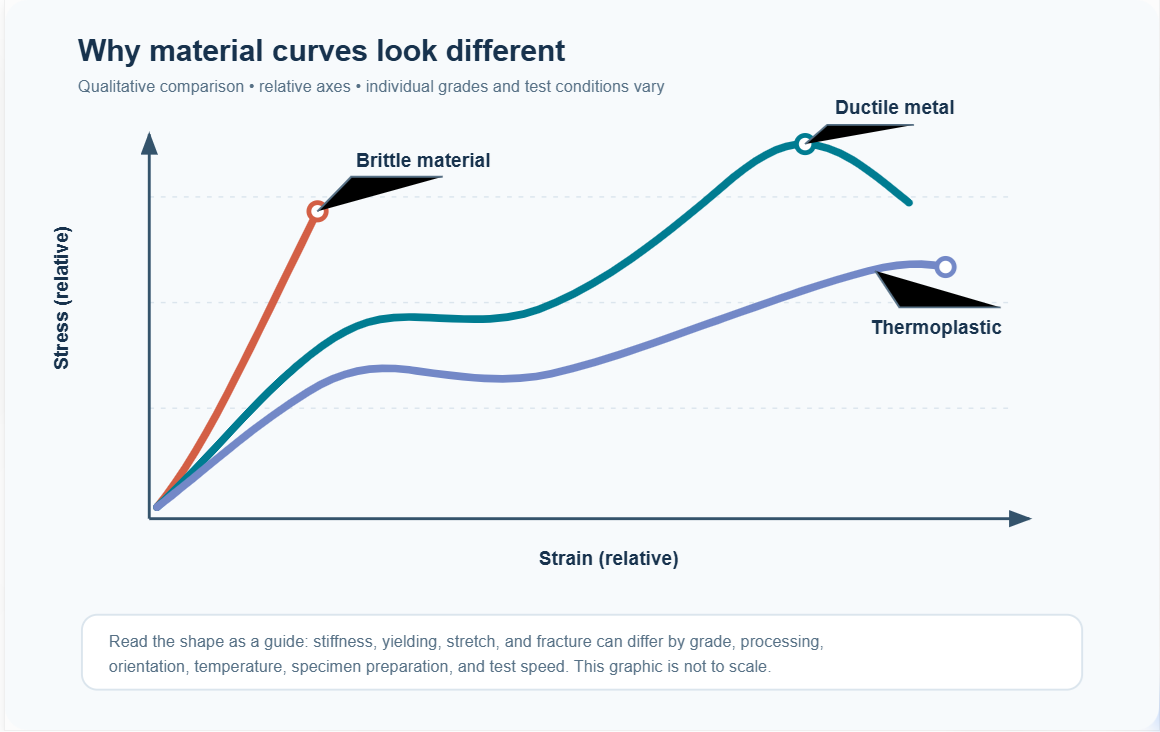
The curve’s form depends on composition, processing, specimen preparation, temperature, loading rate, and other test conditions. Broadly:
- Ductile metals often show an elastic region, yielding, substantial plastic deformation, a maximum engineering stress, and then necking before fracture. Some metals have a distinct yield point; others require a defined proof-stress method.
- Brittle materials usually show limited strain before fracture and may have little or no visible plastic region in a tensile test.
- Thermoplastics can show a range of responses, including an initial elastic region, yielding, necking, drawing, or strain hardening. Their measured behavior can change with temperature and test speed.
- Elastomers can undergo large strains and often show a strongly nonlinear curve, so a single initial slope may not describe their stiffness across the full test range.
- Composites may show direction-dependent behavior. The specimen orientation and reinforcement direction should be reported because they can strongly affect the measured curve.
These are patterns, not substitutes for test data. Material grade and test conditions can change the shape significantly.
Engineering stress-strain versus true stress-strain
Engineering stress uses the original cross-sectional area and engineering strain uses the original gauge length. This is a common way to report tensile-test data and makes results easier to compare under a defined standard method.
True stress and true strain account for changes in specimen dimensions during deformation. Before localized necking, true stress is often calculated from the instantaneous load and area, while true strain uses the logarithm of the ratio between current and original gauge length. Once necking begins, a simple conversion based on uniform deformation is no longer sufficient: the local shape and strain field need to be measured or otherwise accounted for.
Always check which definitions a graph uses. Two curves labeled “stress-strain” may not be directly comparable if one is engineering data and the other is true stress-strain data.
How is the curve produced in a tensile test?
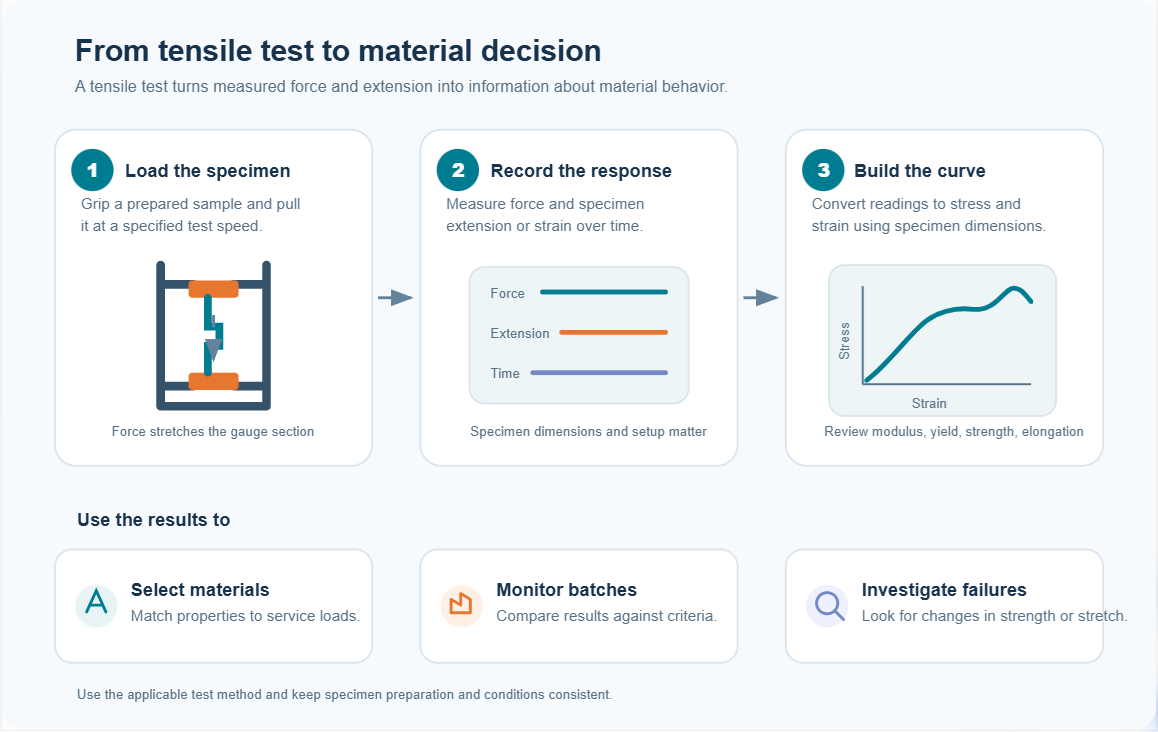
In a tensile test, a prepared specimen is held in grips and pulled at a specified rate. The test system records force and elongation or strain until the required endpoint, which may be yield, a specified elongation, maximum force, or fracture, depending on the method.
A reliable curve depends on more than the load frame. The specimen’s dimensions and shape, correct gripping, alignment, load measurement, extension measurement, test speed, and environmental conditioning all affect the result. An extensometer or other suitable strain-measurement system may be needed when accurate strain or modulus values are required; crosshead movement is not always a direct substitute for specimen strain.
For plastics, ASTM D638 and ISO 527 are widely used tensile-property methods. They define important aspects of specimen preparation and test procedure. The applicable standard, edition, specimen type, test speed, conditioning, and reported properties should be selected for the material and purpose of the test. A test should not be described as compliant with a standard unless the setup and procedure meet that standard’s requirements.
How do engineers use stress-strain results?
Stress-strain data help answer practical questions such as:
- Will a material be stiff enough? The elastic modulus helps compare deformation under load.
- When does permanent deformation begin? Yield strength or a defined proof stress provides a limit for design or inspection.
- How much tensile load can it withstand? UTS gives the maximum engineering stress recorded in the test.
- How much can it elongate? Strain at yield and elongation at break help describe ductility and deformation capacity.
- Are production batches consistent? Repeated tests can reveal shifts in strength, stiffness, or elongation.
- Did a material change after processing? Comparing curves can help assess changes due to formulation, orientation, aging, or manufacturing conditions.
No single value captures every aspect of performance. A packaging film, molded plastic part, rubber seal, and structural metal component may need different properties and test methods. Choose the metric that matches the product’s real loading conditions and acceptance criteria.
Common mistakes when interpreting a stress-strain curve
- Treating stress and force as interchangeable. Force is the measured load; stress is force divided by area.
- Assuming strain has units of length. Strain is a ratio, though it is often reported as a percentage.
- Calling every transition a yield point. Some materials do not have a distinct yield point, so a specified proof-stress method may be needed.
- Confusing UTS with fracture stress. The peak engineering stress and the final fracture point can be different.
- Comparing curves without checking the test conditions. Specimen geometry, speed, temperature, conditioning, and measurement setup all matter.
- Assuming crosshead displacement equals specimen strain. Machine and grip movement can contribute to displacement; use a suitable strain measurement when the method requires it.
- Comparing engineering and true stress as if they were the same. They use different area and strain definitions, particularly after deformation becomes large.
Frequently asked questions
Q1. What does the slope of a stress-strain curve represent?
In the initial linear region, the slope represents the elastic modulus. It describes stiffness under those test conditions. The slope outside that region may describe other deformation behavior and should not be called Young’s modulus.
Q2. Is the stress-strain curve the same for every material?
No. Material type, grade, processing history, orientation, specimen geometry, test speed, and temperature can all affect the curve. The same material may also produce different results when tested under different conditions.
Q3. Does a higher UTS always mean a better material?
No. A higher UTS means the test recorded a higher maximum engineering stress, but it does not by itself show stiffness, elongation, toughness, fatigue life, or suitability for a particular product. Select materials against the full set of service requirements.
Q4. What is the difference between stress-strain and load-extension graphs?
A load-extension graph plots the measured force and extension for a specific specimen. A stress-strain graph converts those measurements using the specimen’s dimensions, which supports comparisons between specimens when the test method and conditions are consistent.
Q5. Which machine is used to generate a stress-strain curve?
A tensile testing machine or universal testing machine can generate the force and extension data used to produce a tensile stress-strain curve. The appropriate grips, load capacity, extension or strain measurement, software, and test procedure depend on the specimen and standard being followed.
Q6. Use tensile data to make better material decisions
A stress-strain curve turns a tensile test into a fuller picture of material behavior. Reading its slope, yield region, peak, and fracture point together can help a laboratory compare materials and monitor product quality. For meaningful comparisons, keep the specimen preparation, test method, equipment setup, and reporting criteria consistent.
Pacorr’s tensile testing machines and servo-drive controlled universal testing machine are designed for tensile testing and other mechanical tests. Select a configuration based on your specimen, measurement needs, and applicable test method.
Recent Blogs
Enhance your understanding of testing and precise quality control indistinct applications with our
knowledge based articles coming from top editors of industry leaders.
Our USP's
Demonstration of Machine
- Try Before You Decide
- Experience Before You Invest
- See It in Action – Free Demo
Global Reach
- Delivering Excellence Worldwide
- Serving Across Borders
- Your Global Supply Partner
On-Site Support
- Support That Comes to You
- On-Ground Assistance, Anywhere
- We Reach Where You Are
Team Strength
- Powered by Expert Minds
- Driven by Skilled Professionals
- Engineering Excellence Team
Manufacturing
- Precision-Driven Manufacturing
- Smart & Automated Production
- Engineered In-House Excellence
