
Two samples can look alike yet transmit light differently. Two production batches can also meet the same dimensional specification while showing a visible shade difference. Spectrophotometry helps turn these optical differences into information that laboratories and manufacturers can evaluate.
This guide explains the spectrophotometer principle, diagram, components, working process and applications. It also separates laboratory absorbance testing from industrial colour measurement, so the scientific explanation leads to a practical instrument choice.
What is a Spectrophotometer?
A spectrophotometer is an optical instrument that measures light intensity at selected wavelengths to determine a sample’s transmittance, absorbance or reflectance. Laboratory models support concentration measurements using suitable analytical methods, while colour-measurement models record spectral data to calculate colour coordinates and differences under specified conditions.
The instrument is the spectrophotometer; the measurement technique is spectrophotometry. Its useful output depends on the optical design, wavelength range, sample accessory and method. A spectrum plots the measured response against wavelength, showing where that response changes.
This distinction matters in purchasing. Measuring a dissolved dye concentration and checking whether a moulded plastic part matches an approved colour are different tasks. Both can involve spectrophotometry, but they require different sampling arrangements and calculations.
Spectrophotometer Principle: Light, Wavelength and Measurement
The working principle of a spectrophotometer is to compare a wavelength-specific light signal from a sample with an appropriate reference. In transmission measurements, the detector senses the light reaching it after passage through the sample; absorbance is calculated from the reference and sample signals.
What do wavelength, transmittance and absorbance mean?
- Wavelength, λ: the spatial period of light, commonly reported in nanometres (nm). A sample may respond strongly at one wavelength and weakly at another.
- Transmittance, T: the ratio of transmitted sample light intensity, I, to reference intensity, I0, measured under the same conditions. For solution analysis, the blank establishes the reference.
- Absorbance, A: the negative base-10 logarithm of transmittance. It is dimensionless, although instruments often label the reading Abs or AU.
- Reflectance: a measure of returned light under a defined illumination and collection geometry. Colour instruments commonly report a spectral reflectance factor relative to a calibrated reference.
%T = 100 × T
A = −log10(T) = log10(I0 / I)
When entering percent transmittance, use A = −log10(%T / 100).
| Transmittance | Absorbance |
|---|---|
| 100% | 0 |
| 50% | Approximately 0.301 |
| 10% | 1 |
| 1% | 2 |
Absorbance is not the percentage of light absorbed. Each increase of one absorbance unit corresponds to a tenfold reduction in transmitted light relative to the reference. Scattering, reflections and fluorescence can complicate the interpretation, so loss of detected light must not automatically be attributed to absorption by the target compound.
Why is wavelength selection important?
Select a wavelength where the analyte gives a useful response and interference is controlled. The absorption maximum, λmax, is often suitable, but a validated method may specify another wavelength. An apparently colourless solution can absorb ultraviolet radiation, so appearance alone does not establish whether UV-Vis analysis will work.
Beer–Lambert Law and Its Importance
The Beer–Lambert law connects absorbance with the amount of an absorbing species in a defined light path. At a fixed wavelength, under suitable conditions:
c = A / (εl)
- A: absorbance at the selected wavelength.
- ε: molar absorption coefficient at that wavelength, commonly expressed in L mol−1 cm−1.
- l: optical path length through the sample, in centimetres when using those units.
- c: amount concentration, in mol L−1.
The coefficient is specific to the absorbing species, wavelength and measurement conditions. The relationship assumes a sufficiently narrow spectral bandwidth and a suitable homogeneous sample. Chemical changes, significant scattering, interfering absorbers or instrumental limitations can prevent a simple proportional relationship.
Worked example: calculating concentration
Consider an illustrative solution with A = 0.480, ε = 12,000 L mol−1 cm−1 and l = 1.00 cm. Its concentration is 0.480 / (12,000 × 1.00) = 0.0000400 mol/L, or 40.0 µmol/L. If this solution was prepared by diluting the original sample fivefold, the original concentration is 200 µmol/L. These numbers demonstrate the calculation; they are not a Pacorr test result.
When ε is unknown or the assay includes a colour-forming reaction, use standards of known concentration to establish a calibration curve. A straight line is acceptable only over the range supported by the method and data. Do not extrapolate beyond that range simply because software displays a concentration.
Spectrophotometer Diagram with Explanation
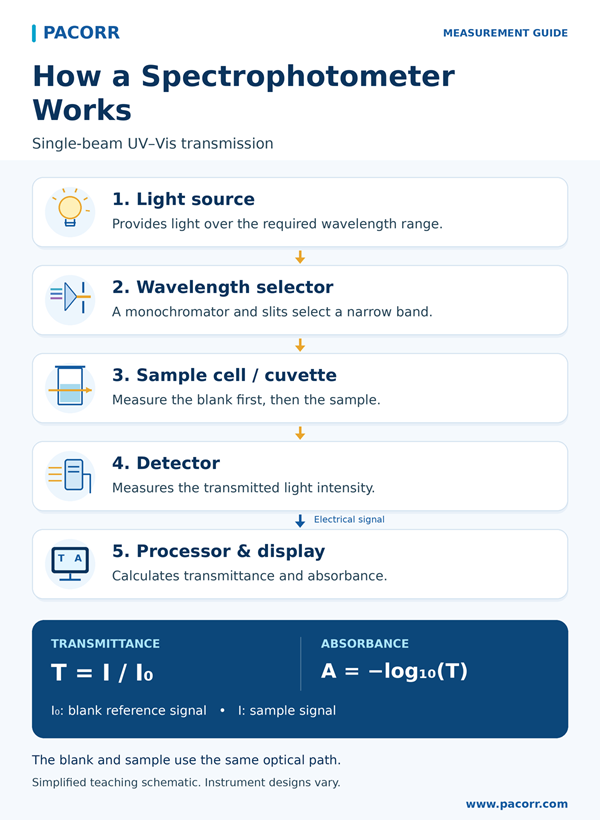
This diagram shows one common scanning UV-Vis arrangement. The light source produces radiation, the wavelength selector isolates a band, and the detector measures the transmitted signal. The reference measurement supplies I0; it is not normally obtained by placing a second detector inside the cuvette.
Provides radiation over the required range.
Monochromator and slits select a narrow band.
Reference-corrected input I₀; transmitted output I.
Converts the received light into an electrical signal.
Calculates T and A; applies a method if concentration is required.
Other spectrophotometer technologies arrange the optics differently. In a diode-array design, light can pass through the sample before a polychromator separates it across an array. In a reflectance instrument, collection optics receive returned light from the sample surface. The transmission diagram therefore should not be used as the exact internal layout of every portable colour instrument.
Main Components and Spectrophotometer Instrumentation
| Component | Function and practical consideration |
|---|---|
| Light source | Deuterium and tungsten-halogen lamps, xenon sources or LEDs are used in different designs. The source must support the required spectral region and stability. |
| Monochromator or spectral optics | Gratings or prisms disperse light. Slits select a finite bandwidth in scanning instruments; array designs resolve wavelengths at the detector. |
| Mirrors, lenses and slits | Direct and focus the beam. Alignment and slit settings influence throughput and spectral resolution. |
| Cuvette or sample accessory | Holds a solution, film, solid or other sample reproducibly. Path length, material and geometry must match the measurement. |
| Detector | Photodiodes, detector arrays or photomultiplier devices convert light to a measurable electrical signal, depending on the design. |
| Electronics and software | Process reference and sample signals, display spectra and calculate results. Stored methods and traceable records support consistent operation. |
A narrower spectral bandwidth can separate nearby spectral features, but reduces the light available and may require longer measurement time. Select settings that provide adequate resolution and signal quality for the method, rather than assuming the smallest slit is always best.
Choosing the right cuvette
Check the manufacturer’s transmission range for the exact cuvette material. Suitable UV-grade quartz or fused silica is commonly used for UV measurements; ordinary glass and many plastics are unsuitable at shorter UV wavelengths. Chemical resistance also matters. A solvent-compatible cell may still transmit poorly at the analytical wavelength.
Keep optical faces clean and consistently oriented. Fill sufficiently to cover the beam, remove bubbles without contaminating the sample, and use the specified path length. A 10 mm cell has a 1 cm path length; that dimension is not the volume of solution it holds.
How Does a Spectrophotometer Work?
For a solution assay, the instrument records a blank, measures the sample at the specified wavelength and calculates absorbance or transmittance. A suitable calibration or absorption coefficient then converts the optical result into concentration.
- Define the measurement. Identify the analyte, sample matrix, wavelength, required reporting units and acceptance criteria before choosing a mode.
- Prepare the instrument. Follow its start-up, warm-up and performance-check instructions. Confirm the correct sample accessory and method settings.
- Prepare the blank and standards. The blank should represent the solvent and applicable reagents or matrix contributions without the target response. Prepare standards using the prescribed procedure.
- Establish the baseline. Measure the blank with the same wavelength, cell arrangement and relevant conditions as the sample.
- Measure the sample. Mix appropriately, inspect the cell for bubbles, close the compartment and record readings within the validated range.
- Check the result. Review quality-control samples, replicate agreement, dilution factors and unusual spectral features. Investigate failed checks before reporting.
- Retain the conditions. Record instrument identity, method, wavelength, path length, sample preparation, reference and calculation.
Reflectance colour measurement uses a different workflow: standardize with the specified reference standards, select colour settings, position the specimen and compare it with an approved master. Pacorr’s portable spectrophotometer operating guide provides further orientation; use the current manual for the exact model and accessory.
Types of Spectrophotometers
Classify spectrophotometers by separate characteristics: spectral coverage, optical design, measurement mode and sample format. These categories overlap. For example, a benchtop instrument can be both UV-Visible and double-beam.
| Classification | Options and selection implications |
|---|---|
| Spectral region | Visible, UV-Visible and UV-Vis-NIR systems cover different wavelength ranges. Confirm the usable range, including the source, detector and sample accessories. |
| Optical arrangement | Single-beam systems measure reference and sample sequentially. Double-beam systems compare sample and reference paths, alternately or simultaneously depending on the design. |
| Spectral acquisition | Scanning designs measure wavelengths sequentially. Array systems capture many wavelength channels rapidly. Resolution and stray-light performance remain model-specific. |
| Measurement mode | Transmission is useful for suitable liquids and transparent samples. Reflectance is used for opaque materials and surface-colour work with appropriate optics. |
| Sample format | Cuvette, microvolume, microplate, flow-cell, benchtop surface and portable surface arrangements meet different sample and throughput needs. |
UV-Visible spectrophotometry
UV-Vis spectrophotometry measures optical response in ultraviolet and visible regions. For introductory discussion, UV is often described as approximately 200–400 nm and visible light as approximately 400–700 nm; these are practical boundaries, not universal instrument specifications. Some systems extend below or above these ranges.
Absorption in this region commonly involves electronic transitions. A spectrum can help select an analytical wavelength, examine changes in a known material or support identification alongside other evidence. A single peak is rarely enough to identify an unknown mixture conclusively.
Single-beam, double-beam and microvolume systems
Reference comparison in a double-beam design can compensate for some source drift, but does not correct a contaminated cell or inappropriate blank. Instrument performance must still be verified. Microvolume systems use a short, controlled path length for small liquid volumes; shortening the path can keep concentrated samples within the measurable absorbance range. Check whether the displayed value is measured absorbance or a path-length-normalized equivalent.
How Do Related Spectroscopy Technologies Differ?
The word spectrophotometer is used broadly, but the physical measurement must remain clear. Related techniques provide different information:
- Visible colour spectrophotometry: records spectral reflectance or transmittance and calculates colour values for specified conditions.
- Near-infrared spectroscopy: can support composition or moisture predictions using application-specific calibration models. Such predictions need representative reference data.
- Infrared and FTIR spectroscopy: investigate vibrational absorption; FTIR uses an interferometer and mathematical processing rather than the simple scanning layout shown above.
- Fluorescence spectroscopy: detects emission following excitation. A spectrofluorometer uses an appropriate excitation and emission arrangement; this is a different signal from transmitted-light absorbance.
- Atomic absorption spectroscopy: determines suitable elements using absorption by free atoms, with atomization and element-specific analytical conditions.
- Raman spectroscopy: measures wavelength-shifted scattered light. It is not another name for conventional UV-Vis absorption spectrophotometry.
Portable describes the instrument’s format, not its measurement capability. Confirm the technique and sample compatibility before treating two portable instruments as alternatives.
Uses of Spectrophotometers in Laboratories and Industry
The main uses of spectrophotometers are measuring optical properties, quantifying suitable analytes, following changes over time and comparing product colour. The result becomes useful when it answers a defined analytical or manufacturing question.
- Quantitative analysis: estimate the concentration of a suitable absorbing species using a validated calibration or known coefficient.
- Spectral investigation: compare wavelength-dependent responses of materials under controlled conditions.
- Kinetic studies: follow absorbance changes over time when the signal is linked to a reaction and temperature is controlled.
- Material transmission: assess how a suitable film, window or liquid transmits selected wavelengths.
- Colour quality control: compare a production sample with an approved reference using defined colour metrics.
For production teams, Pacorr’s discussion of colour consistency checks connects instrumental colour measurement with routine manufacturing inspection.
Spectrophotometer Applications in Different Industries
| Industry or setting | Typical task | Key consideration |
|---|---|---|
| Chemistry and research | Concentration analysis and reaction monitoring | Control solvent, wavelength, temperature and interfering species. |
| Biotechnology | Nucleic-acid measurements, protein assays and culture monitoring | Use assay-specific coefficients or standards; scattering and absorbance are different signals. |
| Pharmaceutical laboratories | Suitable assays, dissolution measurements and analytical development | Use validated methods and qualified, fit-for-purpose equipment. |
| Water and environmental testing | Method-specific colorimetric determinations | Reagent chemistry, matrix effects, reporting limits and quality controls govern the result. |
| Food and beverages | Selected ingredient assays and colour comparisons | Separate chemical concentration measurements from appearance measurements. |
| Plastics, paints and coatings | Shade consistency and batch comparison | Match geometry, thickness, surface preparation, backing and colour settings. |
| Textiles, paper and printing | Dye-lot, substrate and printed-colour evaluation | Control texture, orientation and the influence of fluorescent brighteners. |
An instrument’s ability to measure an optical signal does not prove food safety, identify every impurity or establish complete material performance. The analytical method determines what conclusion is justified. Colour, gloss, haze, strength and chemical composition are distinct properties and may require different equipment.
A note on OD600 and biological samples
OD600 is widely used to monitor microbial suspensions, but the signal is dominated by scattering rather than pure molecular absorption. Establish the useful range and a suitable relationship to cell density for the organism and instrument. OD600 alone is not a viable-cell count and should not be converted directly to colony-forming units without a validated correlation.
Practical Testing Examples
Example 1: using a calibration curve for a solution
Suppose a method measures a coloured analyte at a specified wavelength in matched 1 cm cells. The following invented dataset illustrates the calculation; it is not validation data or a product-performance claim.
| Concentration (mg/L) | Measured absorbance |
|---|---|
| 0 | 0.010 |
| 2 | 0.170 |
| 4 | 0.330 |
| 6 | 0.490 |
| 8 | 0.650 |
These values follow A = 0.080c + 0.010, where c is in mg/L. A diluted unknown giving A = 0.410 has c = (0.410 − 0.010) / 0.080 = 5.00 mg/L. If 10.0 mL of original sample was made up to 100.0 mL, the dilution factor is 10 and the original concentration is 50.0 mg/L.
Real calibration data contain variation. Check independent control samples, residuals, replicate precision and the method’s acceptance limits. A high correlation coefficient by itself does not establish freedom from interference or suitability for the unknown sample.
Example 2: comparing the colour of plastic parts
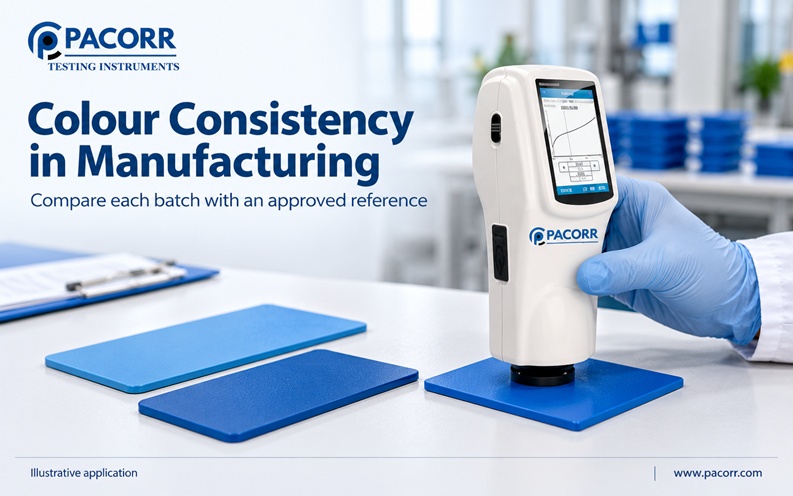
A factory compares moulded parts with an approved colour master. The operator uses a suitable reflectance instrument, standardizes it, fixes the sample orientation and backing, and measures several representative locations. The record includes the measurement geometry, illuminant, observer and colour-difference formula.
For a simplified CIELAB example, a reference has L* = 50, a* = 10, b* = 20 and the sample has L* = 51, a* = 12, b* = 18. The differences are +1, +2 and −2. Using ΔE*ab = √[(ΔL*)² + (Δa*)² + (Δb*)²], the colour difference is 3.0. These are illustrative coordinates, not an acceptance recommendation.
A ΔE*ab value cannot be treated as numerically interchangeable with CIEDE2000. Acceptance depends on the agreed formula, tolerances, product and measurement conditions. Pacorr’s guide to measuring colour difference offers related production context.
Industrial Colour Measurement: Settings That Must Match
A colour spectrophotometer measures spectral data; colour coordinates are calculated using a defined illuminant and standard observer. This supports repeatable comparisons only when the sampling and calculation conditions are consistent.
- Geometry: configurations such as 45°/0° and diffuse/8° describe illumination and collection angles. They are not interchangeable measurement conditions.
- SCI or SCE: specular component included or excluded settings determine how mirror-like reflection contributes in compatible instruments.
- Illuminant and observer: D65 is a standard illuminant used in colour calculations; 2° and 10° refer to standard-observer functions, not the angle at which an operator holds the device.
- Sample presentation: thickness, texture, backing, aperture coverage and orientation can change a result. Establish a consistent procedure.
- Fluorescence and lighting: brighteners or fluorescent materials require suitable UV control and methods. Ordinary spectral comparisons may need additional care.
Record these conditions with the result so another operator can reproduce the comparison.
Visual evaluation under controlled lighting can complement instrument readings. A colour matching cabinet helps compare appearance under specified light sources, including checks for metamerism, where samples match under one light but differ under another. It does not replace quantitative spectral measurement.
Blanking, Calibration and Performance Verification
Blanking establishes a measurement baseline. Analytical calibration relates response to known concentrations. Performance verification checks whether the instrument meets specified requirements. These activities serve different purposes.
- Blank or reference measurement: accounts for the selected baseline, such as solvent and cell contributions, within the method’s design.
- Analytical calibration: measures standards to establish the relationship used to calculate an unknown.
- Instrument verification: may assess wavelength accuracy, photometric accuracy, repeatability, stray light and resolution using suitable reference materials and procedures.
- Colour-instrument standardization: uses the model’s specified white reference and dark or zero procedure, where required. Keep the standards clean and use their assigned data.
A successful blank does not demonstrate wavelength accuracy. Equally, an instrument verification does not validate a new sample matrix or analytical procedure. Choose the checks and frequency from the instrument instructions, method and laboratory quality system; there is no universal interval for every spectrophotometer.
Advantages of Using a Spectrophotometer
- Numerical results: turns optical changes into values that can be recorded, compared and trended.
- Flexible measurements: supports fixed-wavelength readings, scans or time-based measurements where the instrument provides those modes.
- Efficient routine work: established methods can support repeated testing and automated processing.
- Useful sample conservation: suitable non-reactive measurements can preserve samples, while microvolume configurations reduce the volume needed.
- Better production records: colour coordinates and spectra help document batch comparisons and investigate changes.
These benefits depend on method suitability and instrument capability. Sample preparation, reagent reactions, heating or intense illumination may alter a specimen, so spectrophotometric testing should not always be described as non-destructive.
Limitations and Common Measurement Mistakes
| Problem | Why it matters / action |
|---|---|
| High absorbance | Too little transmitted light and stray light can distort readings. Dilute or change path length using an appropriate method. |
| Cloudiness or bubbles | Scattering can appear as increased absorbance. Investigate preparation; do not filter indiscriminately if doing so removes the analyte. |
| Incorrect blank | Unmatched solvent, reagents or cells can bias the baseline. Use the method-defined reference. |
| Dirty or unsuitable cell | Fingerprints, scratches or UV absorption by the cell can interfere. Check cleanliness, material and orientation. |
| Overlapping spectra | Several components may contribute at the same wavelength. Use a selective method, separation or additional evidence where needed. |
| Changing chemical conditions | pH, temperature, reaction time or unstable samples can change the response. Control and document these variables. |
| Mismatched colour settings | Different geometry, backing or illuminant/observer settings undermine comparisons. Match the full measurement procedure. |
Do not assume that a negative absorbance is a negative concentration. It often indicates a reference mismatch, drift or a small signal near the baseline. Investigate the cause. Likewise, a precise-looking digital value can be consistently wrong when the method or sample preparation is unsuitable.
Difference Between a Spectrophotometer and a Colorimeter
A spectrophotometer resolves optical response by wavelength. A laboratory filter colorimeter uses selected bands for suitable solution assays, while an industrial tristimulus colorimeter uses filtered responses to estimate colour coordinates. The word colorimeter therefore needs application context.
| Instrument | Typical information | Best-fit question |
|---|---|---|
| Laboratory spectrophotometer | Absorbance or transmittance at selectable wavelengths; spectral scans where supported | What optical response or analyte concentration does this method measure? |
| Laboratory filter colorimeter | Absorbance or concentration for selected filter bands and methods | Can this established routine assay be performed adequately? |
| Colour spectrophotometer | Spectral reflectance or transmittance, with calculated colour values | How do these materials differ spectrally and under specified colour conditions? |
| Tristimulus colorimeter | Filter-based colour coordinates and differences | Does the sample meet a suitable routine colour-comparison requirement? |
Spectral data allow additional calculations and comparisons that a three-channel colour reading cannot fully reproduce. However, the name alone does not establish accuracy: compare relevant specifications, sampling and method performance.
For a fuller explanation, see Pacorr’s colorimeter principle, parts and uses guide. A product called a spectrocolorimeter may use spectral measurement, so inspect its stated technology rather than assuming it is a basic filter colorimeter.
How to Select a Spectrophotometer
Start with the decision the result must support, then match instrument specifications and sample handling to that task. A useful purchasing brief includes:
- Sample and purpose: solution concentration, opaque surface colour, film transmission or another defined measurement; include representative samples.
- Wavelength and resolution: required range, spectral bandwidth, wavelength accuracy and any method-specific settings.
- Optical performance: applicable absorbance or reflectance range, photometric accuracy, repeatability, noise and stray-light specification.
- Sampling: cuvette path length and volume, temperature control, aperture, geometry, fixtures, integrating sphere or flow accessory as needed.
- Throughput and records: manual versus automated workflow, data export, method controls and traceability appropriate to the quality system.
- Support and ownership cost: installation, training, verification materials, service, consumables, software and future accessories.
For industrial colour work, explore Pacorr’s portable spectrophotometer and portable spectrocolorimeter pages. Request confirmation of the measurement mode, geometry, aperture and reporting capabilities for your samples. A surface-colour specification does not establish suitability for UV analyte assays, trace-metal analysis or every transparent-liquid measurement.
Ask for an application demonstration with your actual sample and an agreed acceptance rule. A quotation is more useful when it includes the required accessories, reference standards, software and service scope.
Frequently Asked Questions
Q. What does a spectrophotometer measure?
A. It measures wavelength-dependent light signals from a sample relative to a reference. Depending on the design, the reported result can be transmittance, absorbance or reflectance. Concentration and colour coordinates are calculated from those measurements using a suitable method and defined conditions.
Q. What is the basic principle of a spectrophotometer?
A. The instrument compares reference and sample light intensities at selected wavelengths. In transmission analysis, it calculates transmittance and absorbance from their ratio. Where Beer–Lambert conditions apply, absorbance is proportional to concentration and optical path length.
Q. How is concentration calculated from absorbance?
A. Use c = A / (εl) when the absorption coefficient, path length and analytical conditions are appropriate. Alternatively, determine concentration from a validated calibration curve. Apply dilution factors and confirm that the unknown falls within the established measurement range.
Q. Why is a blank used in spectrophotometry?
A. A blank establishes the baseline for the method, accounting for relevant solvent, reagent and cell contributions. It should be prepared and measured under matched conditions. Blanking does not by itself verify instrument accuracy or remove every possible sample-matrix interference.
Q. Why are quartz cuvettes used for UV measurements?
A. Suitable UV-grade quartz transmits shorter wavelengths that ordinary glass and many plastics absorb. Check the certified or specified transmission range for the particular material, alongside solvent compatibility and path length. Not all materials labelled quartz have identical UV performance.
Q. What is the difference between absorbance and transmittance?
A. Transmittance is the transmitted-to-reference light ratio. Absorbance is its negative base-10 logarithm. Thus 10% transmittance corresponds to absorbance 1, and 1% corresponds to absorbance 2. Absorbance is dimensionless and is not simply a percentage of light absorbed.
Q. Can a spectrophotometer measure colour?
A. A suitable colour-measurement instrument can record spectral reflectance or transmittance and calculate colour coordinates. Meaningful comparisons require consistent geometry, sample presentation, illuminant, observer and colour-difference formula. Confirm whether the model supports the required sample and measurement mode.
Q. Can one spectrophotometer test liquids and solids?
A. Some systems accept both with appropriate accessories, while others are designed for a specific sample format. A cuvette holder, film holder, integrating sphere and surface-measurement aperture serve different purposes. Verify the complete configuration rather than assuming universal sample compatibility.
Q. What absorbance range gives reliable results?
A. There is no universal range for every instrument and assay. Use the range established by instrument performance and method validation. Very high absorbance reduces transmitted light, while very small absorbance makes baseline and noise effects more significant. Dilution or a different path length may help.
Q. How often should a spectrophotometer be calibrated?
A. Follow the manufacturer’s instructions, analytical method and quality procedure. Frequency depends on the type of check, use, environment and service history. Distinguish routine blanking or colour standardization from analytical calibration and formal instrument performance verification.
Q. Can a spectrophotometer identify an unknown substance?
A. A spectrum can support identification by comparison with appropriate references, but overlapping signals and sample conditions limit specificity. An isolated wavelength reading rarely identifies a complex unknown. Additional analytical techniques may be needed to establish identity.
Q. Is a colour spectrophotometer a replacement for a gloss meter?
A. Not automatically. Colour and gloss are different properties measured under specified optical conditions. Some instruments offer additional modes, but suitability for a gloss method must be confirmed. A spectral colour result alone is not a standardized gloss measurement.
Conclusion
A spectrophotometer makes wavelength-dependent optical behaviour measurable. Reliable use requires a suitable measurement mode, the correct reference, controlled sample preparation and a justified calculation. In laboratories, this can support concentration analysis and reaction studies. In manufacturing, appropriate spectral colour measurements can support consistent batch decisions.
For an industrial colour-measurement requirement, review Pacorr’s portable spectrophotometer options and share the sample type, surface or transparency, required output and acceptance criteria. Those details help establish whether a proposed instrument and accessory configuration fits the application.