
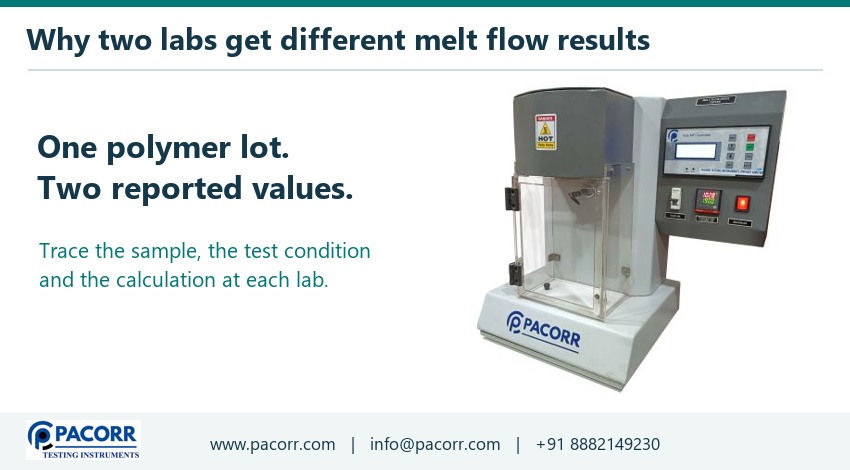
A supplier reports a melt flow index of 6.0 and the receiving laboratory reports 6.8 for material carrying the same lot number. Before either team repeats the test, ask for the unit, temperature, applied load, measurement procedure and sample history behind each number. A shared lot number connects two certificates to a production record. It does not establish that the laboratories tested equivalent portions under equivalent conditions. A well-designed comparison can find out which of those assumptions matters.
The fastest first check often costs no resin. Ask each analyst to reconstruct one result from the original cut mass and interval, or from the original piston displacement record. Then arrange a blind split of a representative sample, with a retained reserve and independently loaded charges at each site. The first exercise can reveal a reporting error. The second can show whether a difference follows a laboratory, a material portion or a particular preparation step.
Make sure both certificates describe the same measurement
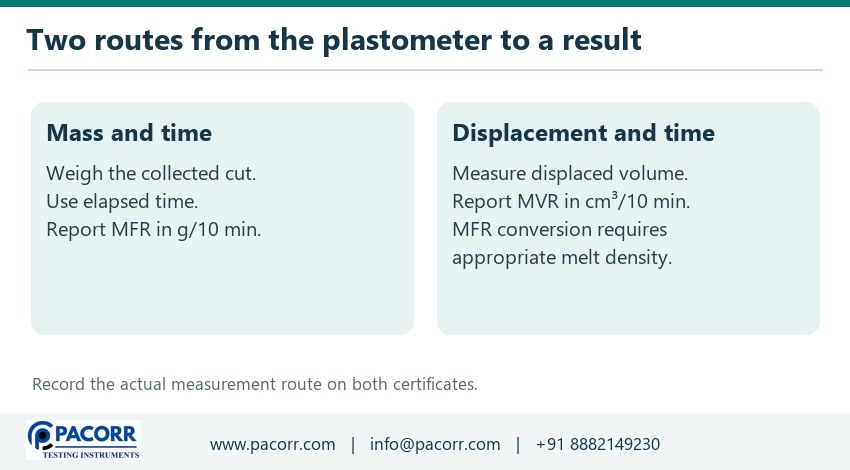
Melt flow index is common shop-floor language. For a comparison, look for the reported quantity. Melt mass-flow rate, abbreviated MFR, is expressed in grams per ten minutes. Melt volume-flow rate, or MVR, is expressed in cubic centimetres per ten minutes. A display or certificate may shorten both to a word such as flow. Read the unit on the original run record. A value of 6 in one unit and 6 in the other describes two different quantities.
Write temperature and applied load immediately beside each value. Conditions belong to the result because the polymer's response depends on them. Two materials in the same polymer family can have different specified conditions. Check the grade designation, agreed standard, edition and measurement procedure against the purchase specification. If information is missing, preserve that fact rather than filling the field from a familiar grade. Use the full procedure applicable to the material and agreement. The official ASTM D1238 standard for extrusion plastometer testing defines routes and conditions relevant to this comparison.
Read the certificate one line further. Some systems display a calculated mass-flow result from a displacement measurement. Others calculate it from weighed cuts. A calculated value needs the correct conversion inputs and units. Ask for the instrument method record and the raw quantity behind the displayed result. Pacorr's guide to the melt flow index tester and its operating principle provides a reference for tracing a result back through the barrel, piston and die.
Build a comparison sheet from original records
| Field to compare | Ask each site for | How it can change the investigation |
|---|---|---|
| Material identity | Grade, lot, package, sampling point and date | Reveals when one site tested a bag and the other a production composite |
| Sample history | Sealing, transport, conditioning, drying and exposure before charging | Separates differences in preparation from differences in the measurement |
| Test condition | Method, revision, procedure, temperature and applied load | Shows whether both numbers answer the agreed specification question |
| Measurement route | Cut mass and timing or displacement, timing and any density used | Makes recalculation possible on the original observations |
| Individual results | Every valid charge, its cuts and stated exclusions | Reveals a persistent offset, a single unusual run or excessive spread |
| Decision basis | Specification limits, rounding rule and agreed decision rule | Distinguishes the lab comparison from the material release decision |
Request the original data to its stored precision. A certificate rounded to one decimal place cannot show whether an underlying result was just above or below a reporting boundary. Where a spreadsheet or laboratory information system imports the value, compare the instrument export with the final certificate for the same run identifier. Inspect unit conversion, decimal separator, rounding stage and copied method names. A correctly measured value can acquire the wrong unit during an otherwise routine transfer.
Retain the sequence of runs. If the receiving site measured several charges on one morning, keep their order and time. Differences that grow with time have a different shape from a fixed offset on every charge. Ask about the material tested immediately beforehand and whether the instrument had settled into its documented operating condition. A retrospective explanation is a lead. To establish it, identify a measurable change and see whether the same change affects a fresh, controlled comparison.
Split a representative sample and blind the portions
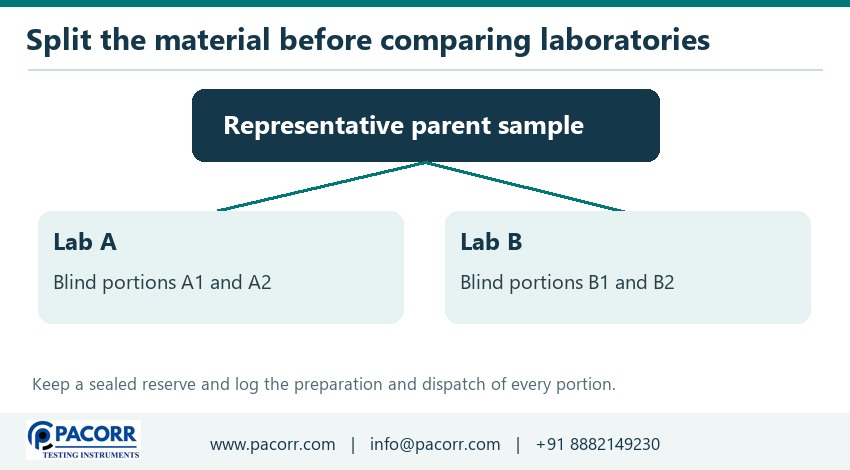
Decide what the comparison is intended to represent. To compare laboratory measurement processes, send equivalent portions of one appropriately prepared parent sample. To investigate differences across a shipment, preserve samples from clearly identified bags, depths or times as separate groups. Combining these exercises prematurely makes the result hard to interpret. A perfectly consistent pair of instruments can give different values for material drawn from different parts of a variable shipment.
Choose a sampling and subdivision procedure suitable for the resin form, lot and applicable agreement. Pellets, blends, regrind and filled grades may segregate during handling. A uniform-looking surface does not demonstrate that a scoop represents the container. Obtain enough material for independent charges at both laboratories, a reserve and any agreed confirmation work. Preserve traceability to the source and document how representative portions were produced. Do not homogenise away a difference between bags when bag-to-bag variation is itself under investigation.
Assign blind codes to the portions before dispatch. The coordinator keeps the link between code, parent sample and destination. Each analyst receives the grade information needed to select the correct procedure and handle the material appropriately, along with the conditions for the trial. Blindness applies to expected results and duplicate identities. It should never conceal handling instructions needed for a valid test. Use suitable sealed containers and record dispatch, receipt and storage times. Keep a reserve under conditions that preserve its usefulness.
Ask each site to schedule independent charges in an agreed order that distributes coded portions over the session. Repeating several cuts from one loaded barrel helps assess that charge. Reloading fresh material provides evidence about variation in charging, timing and preparation. If an operator reports six results, ask whether they came from six independent loads, six cuts from a single load or some combination. Keep a parent charge identifier for every cut so the distinction survives export to a spreadsheet.
Control the preparation and residence history
For moisture-sensitive grades, two laboratories can receive equivalent material and generate different test specimens before the piston begins its measured travel. Compare the material-specific drying procedure, actual drying conditions where recorded, transfer container and time exposed to room air. Moisture uptake and thermal history can affect certain polymers during the test. The direction and size of the effect depend on the material and its condition. Avoid treating a change observed for one grade as a universal correction.
The first split trial may intentionally use each laboratory's routine preparation to see whether their complete reported processes agree. If the difference persists, a second trial can control one preparation variable at a time. For example, agree on the same preparation instructions and record transfer times at both sites. If logistics permit an appropriately preserved common preparation, document what happened during transport after preparation. The material arriving at the second site may no longer have the state measured at dispatch.
Compare the real sequence of charging, preheating, applying the load and starting measurement against the agreed procedure. Two worksheets can show the same nominal preheat period while one analyst starts timing at the first pellet and another at completion of charging. The polymer then experiences a different residence history. Record the actual events used as time references and check whether the measurement occurs in the required piston position range. Time-stamped notes taken during the run are stronger evidence than reconstructed estimates the following day.
Treat unusual extrudate appearance as an observation to investigate. Bubbles, discolouration or an irregular strand may suggest handling, contamination or thermal effects, but appearance alone rarely identifies a unique cause. Retain photographs with the run and charge code where useful. Compare the same material after a documented preparation change. If the appearance changes without the between-lab difference changing, the visual issue may be real while explaining little of the numerical disagreement.
Recalculate a mass result and audit a volume result
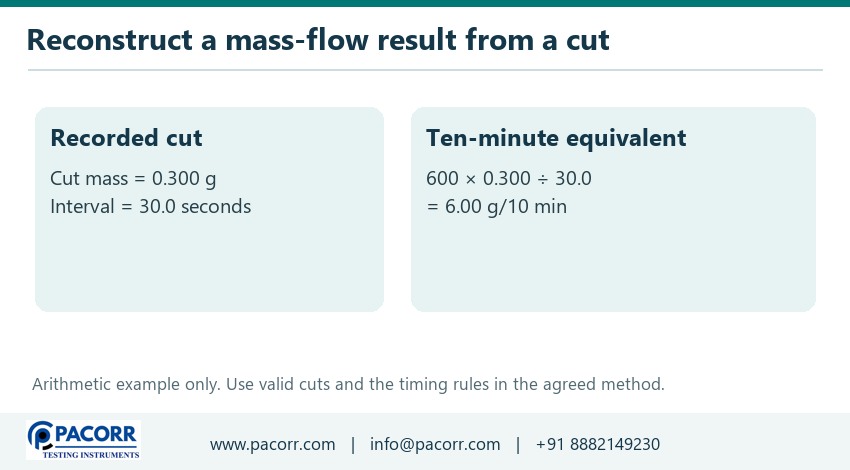
In a simplified mass-cut example, one valid cut weighs 0.300 g and spans 30.0 seconds. The equivalent mass flow over ten minutes is 600 multiplied by 0.300 and divided by 30.0, giving 6.00 g/10 min. The factor 600 converts seconds to ten minutes. If the timing record is in minutes, the expression must use consistent units. This example checks arithmetic. The approved procedure determines valid intervals, cut selection, measurement range and the final reported result.
Recalculate from the individual recorded masses and times before applying final rounding. For a manually cut strand, identify where the cut interval begins and ends, how the strand was collected and which balance entry belongs to it. A tiny absolute mass discrepancy has a larger relative effect on a small cut than on a larger one. Use the procedure's permitted measurement conditions. Arbitrarily collecting a longer cut to improve weighing can introduce a different source of error if the measurement then falls outside the valid interval.
For a displacement-based result, check what the instrument actually measured, which geometry was used to convert motion to displaced volume and the time interval associated with that movement. A site converting MVR to MFR also needs an appropriate melt density for that material at the test conditions. Room-temperature pellet density is a different property. Inspect the density stored in the active grade recipe, including its units, source and applicability. A copied recipe can make several results appear consistently offset.
As a dimensional check, an illustrative MVR of 8.0 cm³/10 min multiplied by a suitable illustrative melt density of 0.75 g/cm³ gives 6.0 g/10 min. The cubic centimetres cancel. Neither number is a recommended density or condition for a particular grade. Where an appropriate density has not been established, report the measured quantity and resolve the agreed comparison route. Choosing a density merely because it makes the two reports match defeats the purpose of the exercise.
Compare the two laboratories charge by charge
Consider this illustrative blind split, tested under the same reported conditions. Laboratory A obtains 5.8, 6.0 and 6.2 g/10 min from three independently loaded charges. Laboratory B obtains 6.6, 6.8 and 7.0 g/10 min from three independently loaded charges. Keep the unrounded source records when doing this calculation in practice. Here the means are 6.0 and 6.8, and each site's observed range is 0.4 g/10 min. One site's results sit consistently above the other's in this small set.
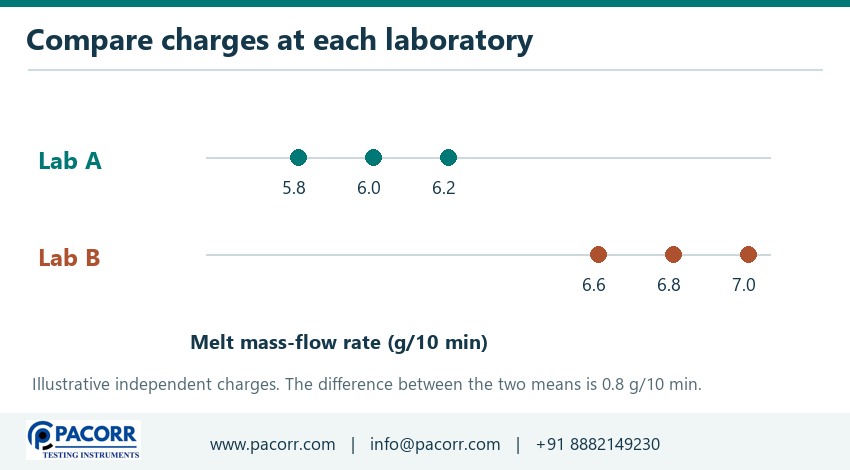
The absolute difference between the means is 0.8 g/10 min. Dividing by their midpoint, 6.4, gives a symmetric relative difference of 12.5%. Using the supplier's 6.0 as the denominator instead gives about 13.3%. Both calculations are transparent once the denominator is stated. They answer slightly different questions. For technical reports, lead with the signed difference in the original unit and name the percentage convention if a percentage helps the reader. A percent without its denominator often creates another disagreement.
What can these six charges establish? They justify checking for a laboratory-associated difference under the conditions of this trial. They do not identify which laboratory is closer to a reference value. Three charges at one site across one session also provide limited information about day-to-day variability. Keep the acceptance decision separate until the specification and applicable precision or decision rules have been checked. A striking graph with no decision rule is evidence for an investigation, not a release instruction.
Repeatability describes agreement under specified repeatability conditions. Reproducibility usually concerns results obtained under changed conditions that include different laboratories. Published precision statements can be relevant only when the material, property, level, test conditions and design support their use. Read whether a stated limit concerns individual results, averages or a different experimental unit. A rule for two results cannot be transplanted mechanically to a comparison of means of several charges. There is no universally acceptable percentage difference across every polymer and measurement procedure.
Locate the difference with a second material
Introduce a suitable stable check material alongside the disputed lot. Its purpose is to see whether the pattern follows the laboratory across materials. Use a check material relevant to the intended method and range. Document its identity, history and any assigned value or internal control history. A retained production lot can be useful for tracking consistency. Its historical average alone does not turn it into a certified reference or establish the accuracy of either instrument.
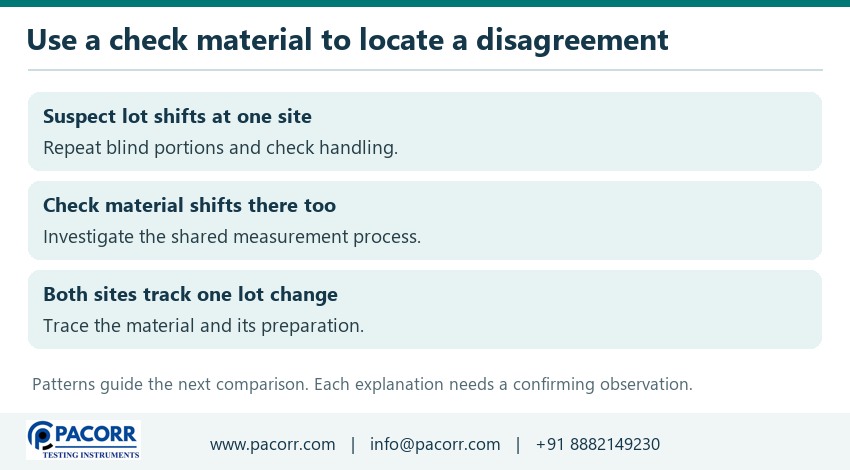
Consider three possible outcomes. If one site now gives higher readings on both the check and the disputed material, a shared measurement factor deserves attention. Inspect the force system, temperature verification, die condition, timing and calculations already identified in the comparison sheet. If both sites agree on the check and disagree only on the disputed material, focus on preparation, material stability, sample heterogeneity and grade-specific settings. If the difference reverses when material changes, examine interaction between method, material and measurement range before applying any global adjustment.
Where two independently identified lots are available, send blind portions of each lot to both sites. Test both lots at each laboratory under the agreed conditions. That crossed arrangement lets the coordinator ask whether the same site reads high on both lots or whether both sites track a change from lot one to lot two. If lot one is tested only in the supplier lab and lot two only in the buyer lab, material and laboratory effects are entangled. More cuts at each location will not undo that design problem.
Check the plastometer with the evidence in hand
Review instrument identification, method file, verification records and service history for the actual test date. A temperature display shows a controller reading. The applicable verification establishes performance at the relevant measurement location and condition. A balance check says something about the weighing system but leaves die condition and piston movement open. Compare the component most likely to affect the observed route. A mass cut collected and weighed independently has a different measurement chain from a calculated flow based on piston motion.
Check records for the die used on the day, its identification, inspection and approved cleaning. Deposits, wear or damage can affect the flow path. Review the piston, load configuration and timing system through the instrument's documented procedures. Record findings before any adjustment and test suitable controls after corrective work. If several changes are made together, the overall method may improve while the cause of the previous difference remains undetermined. Keep the original settings and results traceable in that case.
Pacorr's melt flow index tester is the relevant product family when choosing measurement and recordkeeping capabilities. Specify the grades, required conditions, intended measurement route and raw data the quality team must recover. Pacorr's guide to melt flow testing for polymer quality control gives context for how a flow result fits into incoming and production checks. For a supplier agreement, confirm which features and records the selected instrument configuration actually provides.
Close a supplier inquiry without losing the evidence
A useful conclusion separates confirmed findings from unresolved questions. Suppose both laboratories' raw results agree when recomputed from weighed cuts, but one certificate shows a different value after import. Record the affected transfer field, the identifiers of the runs reviewed and the successful recalculation. Test the corrected reporting path on a fresh record before closing the investigation. Follow the organisations' agreed process to identify any other affected records and to handle release decisions.
A different inquiry might show that the labs agree on newly sealed split portions but disagree on open production bags sampled a week apart. That result supports agreement for the controlled split. It leaves open whether bag-to-bag variation, exposure after opening or a combination explains the original observations. Design the next comparison around the remaining question and retain each bag's identity. The integrity of that conclusion is more valuable to both parties than a new average obtained by mixing all remaining material together.
Attach the sampling map, blind-code key after unblinding, charge sequence, raw measurements, recalculations and verification records. State the specification, the decision rule, who owns the lot decision and what material remains available. Include the date or event that triggers a follow-up comparison. If the matter is being passed to another shift, a new analyst should be able to select the correct reserve portion, repeat the agreed condition and explain which outcome would support or weaken the leading explanation.
Frequently asked questions
Does a common lot number prove two MFI results should match?
A lot number links the samples to a manufacturing lot. It leaves open how each portion was drawn, prepared and stored. To compare the measurement processes, use a documented split from a representative parent sample and test independently loaded portions at both sites. To study variation within the lot, preserve samples from different containers or production times as identifiable groups.
Is it acceptable to average two supplier and buyer results?
An average may describe the numbers received, but it cannot resolve differences in units, method, sampling or sample history. Establish comparability first and check the agreed decision rule. When a lot is close to a specification limit, averaging conflicting results after seeing them can change the decision without resolving why they differ.
Why can several cuts agree while the next charge changes?
Cuts from a single charge share the loading operation and much of the same preparation and thermal history. A fresh charge repeats more of the measurement process. Keep cut identifiers nested under their charge identifiers. Use fresh charges and, when needed, multiple sessions to study variation beyond the timing or weighing of individual cuts.
Can the lab convert a volume-flow result into a mass-flow result?
It can do so when the procedure allows it and the appropriate melt density applies to that material at the test conditions. Record the measured MVR, density, units, conversion and resulting MFR. Where the density source is uncertain, resolve the underlying measurement route before comparing the converted value with a directly weighed result.
How large a difference warrants investigation?
Use the agreement for the grade, the applicable method and precision information relevant to the actual comparison. Also consider proximity to a decision limit and the site's history with suitable controls. Report the absolute difference in g/10 min for MFR and identify any percentage denominator. A universal percentage would ignore differences in material, condition and measurement design.
Which details should a lab send when selecting a melt flow index tester?
Provide the grade families, agreed standard, load and temperature conditions, expected flow ranges, preferred measurement route and required audit records. Include whether the team needs weighed-cut data, displacement records or a traceable conversion. Pacorr's application enquiry team can discuss the required configuration using those details and the lab's reporting needs.
Recent Blogs
Enhance your understanding of testing and precise quality control indistinct applications with our
knowledge based articles coming from top editors of industry leaders.


Our USP's
Demonstration of Machine
- Try Before You Decide
- Experience Before You Invest
- See It in Action – Free Demo
Global Reach
- Delivering Excellence Worldwide
- Serving Across Borders
- Your Global Supply Partner
On-Site Support
- Support That Comes to You
- On-Ground Assistance, Anywhere
- We Reach Where You Are
Team Strength
- Powered by Expert Minds
- Driven by Skilled Professionals
- Engineering Excellence Team
Manufacturing
- Precision-Driven Manufacturing
- Smart & Automated Production
- Engineered In-House Excellence
