
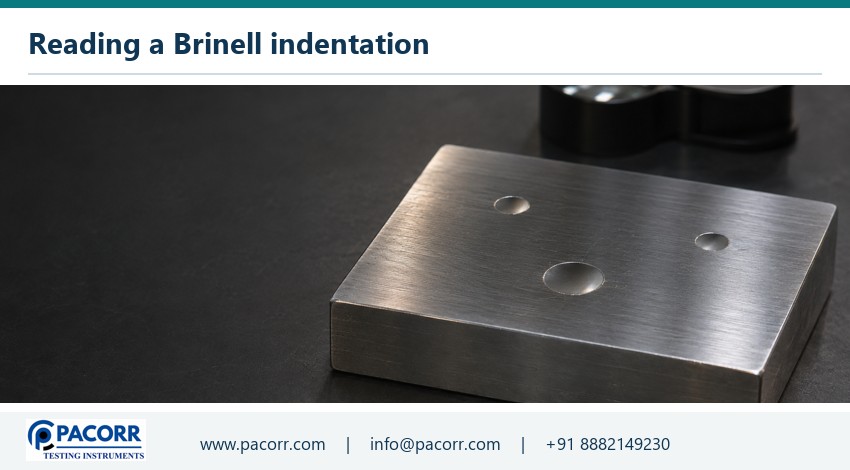
A supplier sends a photograph of a circular impression and a certificate marked “207 HBW 10/3000”. The photograph shows a bright outer ring, a darker depression and a few machining lines. Which circle did the operator measure? What does 3000 mean? And could an error of a few hundredths of a millimetre explain a difference between the supplier’s result and yours?
A Brinell diagram becomes useful when you can connect three things on the same record: the ball and force that made the mark, the optical diameter measured after unloading, and the calculation that produced the hardness value. The worked example below follows those three steps. Its numbers illustrate the reasoning. Production tests use the method, tolerances and decision rules specified for the part.
Read the side view and the plan view separately
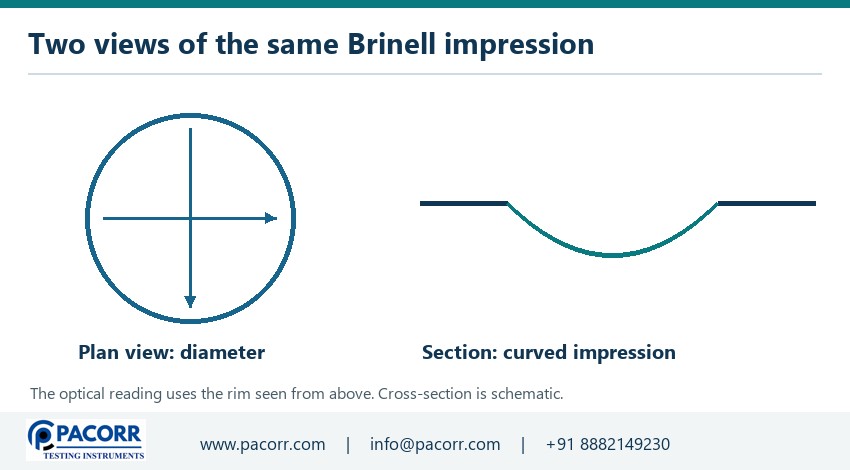
In the side view, a hard ball presses into a prepared metallic surface under a specified force. The sketch usually shows the ball above the material and a shallow curved impression beneath it. The applied force acts along the ball axis. The length marked with an uppercase D is the diameter of the ball. Even if the published drawing enlarges the impression for clarity, the symbol still refers to the actual ball size selected for the test.
The plan view looks straight down at the residual impression after the force is removed. Here the lower-case d represents the mean diameter of that impression. The line crosses from one side of the rim to the opposite side through the centre. It does not run from the centre to the rim. Confusing a radius with a diameter can produce a plausible-looking input and a seriously wrong hardness number.
The side-view depth explains the geometry used in the equation. A conventional optical Brinell result is calculated from the impression diameter, ball diameter and test force. An instrument that measures displacement during loading records a different observable. Before interpreting a diagram from a training sheet or another machine, check which quantity the instrument actually measured and where it appears in the calculation.
Decode a Brinell result from left to right
In “207 HBW 10/3000”, 207 is the reported Brinell hardness, HBW identifies the tungsten-carbide-ball method, 10 is the ball diameter in millimetres and 3000 identifies the nominal force expressed as its kilogram-force equivalent. A force of 3000 kgf corresponds to approximately 29.42 kN. The machine may display the force in newtons, while the designation retains the conventional force number. Write the units explicitly in a calculation worksheet.
A designation may include an additional time value where the governing method requires the duration to be stated. A missing time field on a short designation does not establish precisely how long an operator held the force. The test record should identify the method and applied conditions well enough to resolve that question. When comparing suppliers, request the underlying conditions along with the headline hardness value.
| Mark or symbol | What it identifies | Mistake to catch |
|---|---|---|
| HBW | Brinell hardness using a carbide ball | Treating every hardness scale as interchangeable |
| Uppercase D | Diameter of the test ball | Entering the diameter of the impression |
| Lowercase d | Mean measured impression diameter | Using one radius or selecting a reflection |
| Force designation 3000 | Nominal 3000 kgf equivalent | Entering 3000 N in an equation expecting newtons |
Identify the edge a microscope should measure
The intended measurement is the diameter of the residual indentation where its boundary meets the original surface. In an optical image, illumination can create a bright lip outside the depression or a dark band just inside it. Decide which boundary represents the physical impression under the laboratory’s optical procedure. Adjust focus and illumination to reveal the rim consistently. A visually sharp reflection can be easier to select than the actual boundary.
Start with the entire mark in view. Look for scratches that cross the apparent rim, patches where the edge disappears, or an image clipped by the field of view. Then inspect opposing points at the intended measurement axis. If one edge remains ambiguous after appropriate adjustment, record the difficulty. Selecting the most convenient pair of bright points may give excellent repeatability for the wrong feature.
For automated image analysis, retain the source image and the software’s fitted boundary where the instrument supports it. Overlay inspection can reveal a fitted circle tracking polishing scratches, a halo or debris. Establish how the software handles a broken edge and when an operator is permitted to intervene. Retain both the original and the reviewed measurement under the laboratory procedure so that another person can reconstruct the decision.
Measure two diameters through the centre
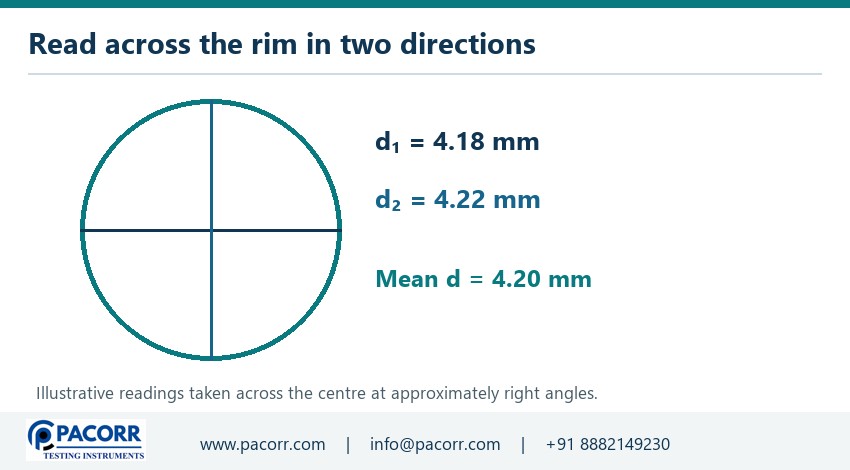
For a conventional Brinell reading, measure the indentation along two approximately perpendicular directions and determine their mean as required by the applicable method. Each line should cross the centre. A line cutting across the circle above its centre is a chord. It will be shorter than the actual diameter even when both endpoints look neatly aligned with the rim. A misplaced chord pushes the calculated hardness upward.
Suppose the two readings are 4.18 mm and 4.22 mm. Their arithmetic mean is (4.18 + 4.22) ÷ 2 = 4.20 mm. Retain both original readings as well as the mean. Their difference is 0.04 mm. That difference may help identify a directional effect, an edge-definition issue or an imperfect impression. The example itself does not supply an allowable difference. Check the criterion that applies to the actual material and method.
When a mark looks distinctly oval, taking further readings at convenient angles until the mean looks familiar is a poor remedy. Review the surface, support, alignment and image orientation, including whether the camera viewed the surface at an angle. Follow the validity and repeat-test provisions in the controlled procedure. A new test, where permitted, belongs at a fresh eligible location with the first observation retained.
Follow one calculation from diameter to HBW
The geometry treats the indentation as a spherical cap. With D and d in millimetres and force F in kilogram-force, the numerical Brinell value is 2F ÷ [πD × (D − √(D² − d²))]. For force entered in newtons, multiply the numerator by the kilogram-force conversion factor, approximately 0.102, or first divide the force by 9.80665 and use the kilogram-force form. Use one conversion route in a calculation.
For the example, D = 10 mm, d = 4.20 mm and F = 3000 kgf. Squaring the two diameters gives 100 and 17.64 square millimetres. Their difference is 82.36. Its square root is approximately 9.075 mm. Subtracting this result from 10 leaves approximately 0.925 mm. Multiplying that difference by π and by the ball diameter produces a denominator close to 29.05. Using unrounded intermediate values, 6000 divided by that denominator gives approximately 206.5.
A rounded figure of about 207 HBW is therefore consistent with the illustrative inputs. Keep full internal precision and round the final result as the applicable procedure requires. If using a published table instead of a calculation, select the column for the correct ball and force and check the units of the diameter. A disagreement between a table and a spreadsheet is a reason to investigate inputs and rounding before questioning the specimen.
See how an edge-reading error moves the result
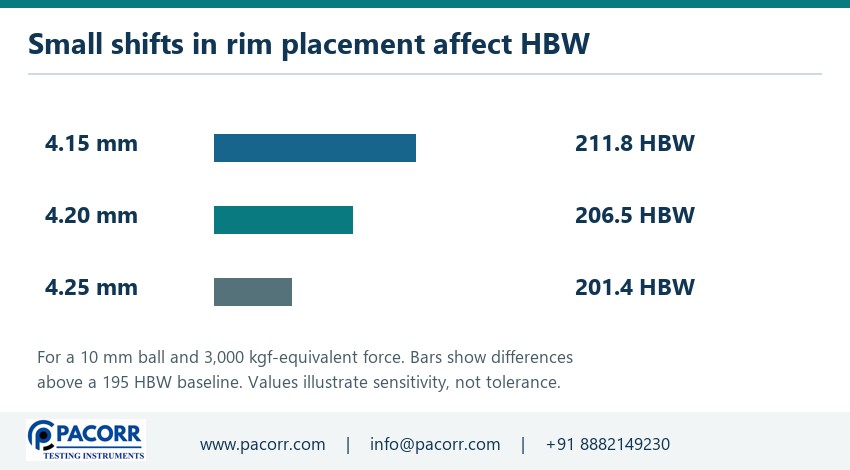
Hold ball diameter and force fixed and consider three possible mean diameters for one nominal mark. At 4.15 mm the calculated value is about 211.8 HBW. At 4.20 mm it is about 206.5 HBW. At 4.25 mm it is about 201.4 HBW. Selecting a wider apparent boundary lowers the calculated hardness. Selecting a narrower one raises it. The same direction of change follows from the larger or smaller curved area in the denominator.
This example can help decide where to investigate a disagreement. If two operators differ by approximately five hardness points at this particular condition, compare their recorded diameters and overlays before adjusting the test force. A difference in where they placed the optical edge might account for a substantial part of the disagreement. Under another force or ball size, the same diameter difference will have a different numerical effect.
Sensitivity to an input is only one part of measurement uncertainty. A real uncertainty assessment also considers the force system, ball, optical scale, repeatability, reference evidence and material effects relevant to the measurement. The three example calculations are not a tolerance specification. They show why a laboratory should retain its raw diameter observations when a result is close to a contractual boundary.
Decide whether the selected ball and force suit the part
A mill certificate, casting drawing or purchase specification may already prescribe the ball and force. Use that requirement as the starting point. Where selection is allowed, the part must provide enough material beneath and around the intended impression, and the resulting mark must be suitable for optical measurement under the chosen procedure. A small part may be unsuitable for a particular combination even though the nominal hardness lies inside the machine’s range.
The force divided by the square of the ball diameter is useful when comparing conventional test conditions. For instance, 3000 kgf on a 10 mm ball and 750 kgf on a 5 mm ball both give a numerical ratio of 30 kgf per square millimetre. This relationship explains why those conditions appear together in discussions of similarity. It does not give blanket permission to substitute one for the other on a customer’s drawing.
Use the controlled edition of ASTM E10 for Brinell hardness of metallic materials when it governs the order. Check the provisions for force and ball selection, specimen suitability, impression dimensions and verification. If the specimen cannot accommodate the specified test, agree a revised test location, representative coupon or alternative method before issuing a certificate. The party interpreting the certificate needs to know which test was actually performed.
Prepare a surface that preserves the property under test
The surface needs to allow a clear indentation and an identifiable optical edge. Scale, coarse tool marks or a rough coating can obscure the rim. Preparation is part of the measurement because the very material removed or altered may be the layer of interest. Record whether the test concerns bulk material, a specified depth, or the as-supplied surface. A polished appearance by itself does not establish that the correct zone was tested.
Aggressive grinding can heat or mechanically alter a surface. On a component with a treated case, removing material may expose a zone with a different hardness. Agree the permissible preparation with the product specialist, use the approved technique and document the location and depth where required. If the drawing asks about a thin hardened layer, review whether the specified Brinell impression samples a volume appropriate to that question.
Check the underside as carefully as the test face. Burrs, dirt or a curved underside can leave the specimen rocking on its support. Some irregular components require a suitable fixture and an agreed orientation. A fixture should secure the part and provide stable support while preserving the intended test location. Once the operator has found a successful orientation, include it on the setup sheet so another shift can reproduce it.
Map the impressions on the component
An indentation permanently deforms its neighbourhood. A nearby mark, an edge or a thin wall can change how the metal supports the next indentation. Use the required spacing and thickness checks for the governing method, material and actual impression size. Sketch the eligible area before testing, especially where a machined face leaves little room between a bore, fillet and external edge.
Give each position a stable name. On a casting this might combine face identification with distance from a gate or datum. On a plate it might identify an edge zone and centre zone. Record which side is up and include a scale or dimensional reference where necessary. A close-up photograph showing only three round marks is difficult to relocate once the part has gone back to production.
Averaging results from different zones can conceal a real gradient. If the drawing requires separate points, list them separately and apply the decision rule for those points. If it asks for a representative mean, keep the individual readings and the sampling basis. Three clear impressions at the most convenient corner cannot demonstrate the condition of an inaccessible boss unless the sampling plan supports that inference.
Separate material variation from reading variation
Start with a question you can answer without changing the specimen. Give two trained readers the same stored image and the same instructions, with independent access to the calibrated measurement scale. Compare their two diameters, edge positions and chosen orientations. If they disagree on one image, making ten new indentations does little to isolate the reading problem. Resolve focus, edge convention or software configuration first.
Next examine repeat readings on an appropriate reference block under the laboratory’s procedure. This checks more of the measurement chain than rereading one image, because it involves making and measuring fresh impressions. Keep the block identification, its certified test condition, location map and remaining usable area. A check performed with a different ball and force may have limited relevance to the condition used on the production part.
Only after these checks compare new indentations at controlled locations on the actual component. Local variation can be genuine, particularly where solidification, heat treatment or prior working differs across a part. Record the location-specific pattern and the consistency of optical readings. A hardness map can support a materials investigation, but it cannot by itself establish the metallurgical cause of a gradient. Link it with processing records or other examination appropriate to the question.
Read a supplier certificate without losing the test context
First match the heat or batch, component identity and test location to the order. Then check the method and edition, reported hardness designation, ball size, force and any required duration. Ask how many impressions were made and how the reported value was selected. A single number copied from a production certificate may represent an individual reading, a mean or another agreed summary. Clarify that distinction before comparing against the limit.
For a borderline result, request the individual diameters and the laboratory’s treatment of rounding. If the acceptance criterion is 205 HBW minimum, an unrounded result, the permitted reporting precision and the agreed decision rule all matter. Resist the temptation to change decimal conventions after seeing the outcome. Document any agreed retest and identify its relationship to the original observation and affected parts.
A useful incoming-inspection record links each supplier result to the local check. If the two laboratories used different test locations, add that information before drawing a trend line. A certificate on a separately cast coupon and a shop reading on a heavily machined region may each be valid for its own purpose. Their numerical difference could reveal a sampling issue before it reveals an equipment problem.
Distinguish Brinell, Rockwell and tensile results
Brinell interprets the optical diameter of a ball impression. Rockwell uses a depth difference under a defined sequence of forces and its own scale. Both are indentation methods, yet their result labels identify different measurement systems. A Pacorr Rockwell hardness tester addresses a Rockwell specification. When a customer explicitly requires HBW, check that the quoted equipment, optics and verification cover Brinell conditions.
Engineering tensile strength comes from maximum tensile force divided by original cross-sectional area. Material-specific empirical relationships sometimes associate a hardness range with tensile strength, but heat treatment, microstructure and material family can change that relationship. If the requirement calls for a measured tensile result, review the universal tensile testing machine and the specimen method as a separate test. A converted estimate should be identified as an estimate wherever it is used.
Pacorr’s guide to testing the quality of metals places different tests in their application context. Its worked explanation of tensile strength describes the original-area calculation. For an investigation involving both a local surface change and bulk mechanical performance, preserve the hardness map and the tensile specimen identity so the two data sets can be interpreted together.
Trace a disputed reading back to the image
Imagine a production sheet showing 212 HBW and a review sheet showing 201 HBW for the same impression. Both quote the same ball and force. The first task is to determine whether both calculations used the same mean diameter. If the recorded means are about 4.15 and 4.25 mm respectively at the example condition above, the arithmetic is internally consistent. The disagreement has moved upstream to how the boundary was identified or calibrated.
Ask each reader to mark the selected endpoints on a copy of the original image without seeing the other reader’s overlay. Compare the two copies at the same magnification. A systematic shift at all four endpoints suggests a difference in edge convention or image scale. One endpoint displaced across a visible scratch points to a more local problem. If the original image lacks the detail needed to decide, document that limit and follow the agreed retest procedure. Preserve the original report and the reason for any correction so that the audit trail reaches the raw observation.
Specify the equipment and evidence needed for optical readings
A purchasing enquiry should include the metals and section sizes, expected hardness band, required standard, specified ball and force combinations, usable test surface and reporting expectations. A bench machine may serve polished coupons, while a large casting introduces access and support questions that cannot be solved by choosing a larger force range. Give the supplier a drawing of the part and the intended test location when discussing a fixture.
Ask how the optical system establishes millimetres at the selected magnification and how the operator checks the boundary being measured. Confirm what can be retained with each record: original image, diameter pair, fitted outline, force, time, operator and part location. For software that rounds a final value, request an example export showing the raw readings as well. This is often more informative than comparing the number of digits on two displays.
Before acceptance of an installation, define how the laboratory will demonstrate performance for the intended configuration. Separate documentation for the machine from documentation for a particular ball, optical system or reference block. Establish a procedure for a damaged indenter, failed check or change of objective. If results leave the lab on signed certificates, define how rejected or superseded records are identified so customers can distinguish them from valid results.
Frequently asked questions
What is the difference between D and d on a Brinell diagram?
Uppercase D is the known ball diameter. Lowercase d is the mean measured diameter of the residual impression. Both must be in the length unit required by the equation, usually millimetres. Mixing the two changes the geometry used in the calculation.
Why do two perpendicular diameters matter?
A single diameter can conceal an elongated impression or an orientation-dependent reading. Keeping the pair lets a reviewer inspect their difference, reconstruct the mean and apply the relevant method criterion to the original observations.
Can I read a Brinell value directly from a photograph?
Only if the image has an appropriate calibrated length scale, clear boundary and suitable viewing geometry, and the ball and force are known. An attractive image without those inputs can show the appearance of a mark but cannot support a traceable HBW calculation.
Does a larger indentation mean the material is softer?
At the same ball diameter and force, a larger mean impression produces a lower calculated hardness. If the ball, force or material preparation changes, check comparability before ranking the parts by their apparent mark size.
Can a Brinell number be reported in MPa as tensile strength?
A measured HBW value and a measured engineering tensile strength are different quantities. Where an approved empirical conversion is permitted for a particular alloy and condition, identify its source, limits and estimated nature. A direct tensile requirement generally calls for a tensile test.
What should I do if an impression touches a scratch or a nearby mark?
Preserve its image and location, record the interference and review the validity rules for the specified method. If a new impression is authorised, choose an eligible fresh position and retain both records. For equipment or fixture enquiries, share the test conditions with Pacorr.
Recent Blogs
Enhance your understanding of testing and precise quality control indistinct applications with our
knowledge based articles coming from top editors of industry leaders.


Our USP's
Demonstration of Machine
- Try Before You Decide
- Experience Before You Invest
- See It in Action – Free Demo
Global Reach
- Delivering Excellence Worldwide
- Serving Across Borders
- Your Global Supply Partner
On-Site Support
- Support That Comes to You
- On-Ground Assistance, Anywhere
- We Reach Where You Are
Team Strength
- Powered by Expert Minds
- Driven by Skilled Professionals
- Engineering Excellence Team
Manufacturing
- Precision-Driven Manufacturing
- Smart & Automated Production
- Engineered In-House Excellence
